1. Problem description
Work of robust control will be shown by the example of a linearized conflict-controlled pendulum. System describing the pendulum dynamics is the following
x1′ = x2 + v,
x2′ = −x1 + u.
Here u and v are scalar controls of the first and second players (the useful control and the disturbance).
Behaviour of the system is examined in the time interval T = [0, θ].
Let's define in the plane x1, x2 the terminal set M as a ball with the radius 2 and the centre in the origin.
The first player's objective is to lead the system to the terminal set M at the terminal instant θ as close to the origin as possible. The second player's objective is opposite.
Proposed robust control is designed for the case when the useful control is bounded, and no restriction for the disturbance is known in advance. Let's define a restriction for the useful control: |u| ≤ 1.
Let's recall the concept of the robust control (to exact formulation, method of construction, and proof of the Theorem about guarantee see Preprint). Robust control is a feedback control with the following properties:
- If the disturbance is not greater then some "critical level" Qmax and the initial position is in the tube of the main stable bridge W then
- a succesful game completion (i.e., leading the system to the terminal set at the terminal instant) is guaranteed despite the disturbance action;
- with that, the "weaker" the disturbance is the "weaker" the useful control should be.
- In the case, when the disturbance is greater then the critical level, some terminal miss is acceptable. There is an estimation from above for the value of the miss.
In the example with pendulum, the critical level Qmax is defined by an inequality |v| ≤ ν.
Note, that the proposed robust control does not realize any criterion of optimality, but provides some reasonable guarantee.
As the disturbance we can take:
- Some open-loop control. In our case, it is sinusoids with different amplitudes and frequencies.
- The optimal control of the second player computed on the basis of a game with some prescribed second player's control restriction and terminal payoff function as Minkowskii functional of the terminal set. This disturbance is called the game disturbance.
2. Simulation results
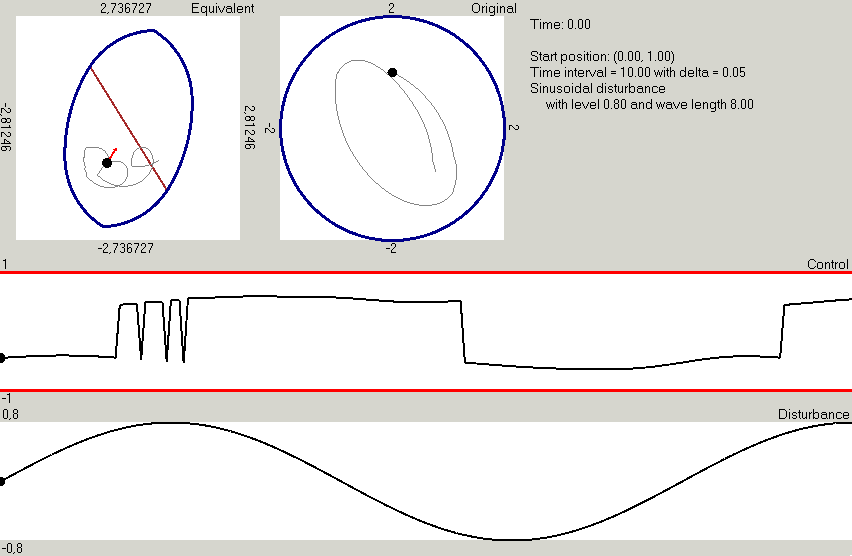
We compute several tests. For all cases, the time interval is [0, 10], the discrete step of control generation is 0.05, the initial position is (0, 1). As the critical level Qmax of the disturbance, we choose the restriction |v| ≤ 1.
Case 1. (animated gif, 1.37mb) Here the disturbance is a sinusoid with the period 8 and the amplitude 0.8, i.e., lower than the critical level.
Case 2. (animated gif, 1.44mb) Here is the example of the game disturbance computed for level |v| ≤ 0.8.
In the figure below, one of the frames for Case 1 is presented.
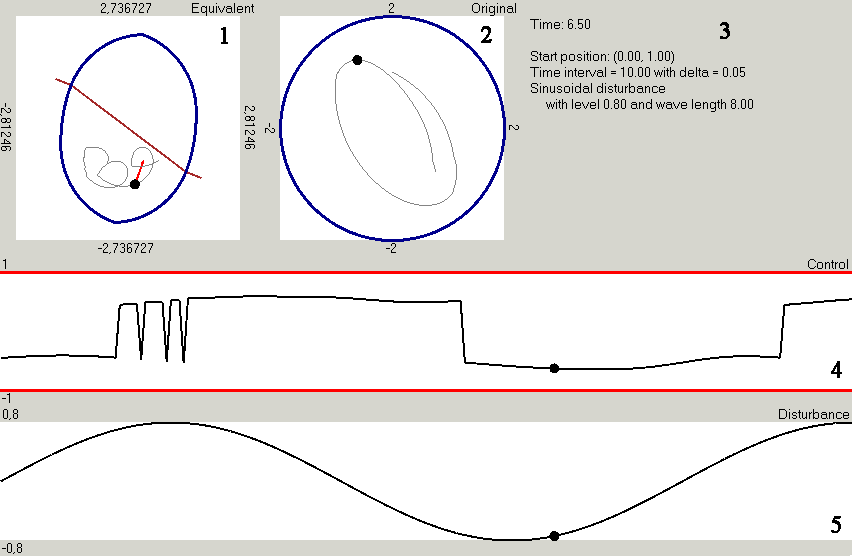
Here you can see:
- The current position of the equivalent system (system (2) in Preprint), which is marked by a black point; a time-section of the main stable bridge W is drawn in blue; the brown line is a switching surface, which is used to choose the sign of the control for the current instant; the red arrow shows the chosen first player's control; the thin gray line is the trajectory of the system.
- The current position in the original coordinates (system (1) in Preprint), which is marked by a black point; the trajectory of the system shown by the thin gray line; and the terminal set M, which is drawn as the blue circle.
- Here are the values of the current instant and simulation parameters.
- The graph of the useful control — robust control — realization. Red lines show the maximal allowed values of the useful control. As you can see, with changing the current position the control value is increasing and decreasing, but (in this case) does not achieve the maximal restrictions.
- The graph of the disturbance realization, which is a sinusoid in this case.
Also you can download the program, which makes the simulations. The program is written for Microsoft Windows 2000/XP. A description of the program abilities is in the next paragraph.
Remark. The program requires the .NET Framework. It is included in the Windows XP Service Pack 1, or can be downloaded from the Microsoft website (23.1mb).
3. Description of the program abilities
The user interface is quite simple and consists of two pages: one with the simulation parameters, and the second page with the simulation results.
Let's examine at first the page with the parameters.

Here you can choose:
- The start point for the system in the original coordinates.
- The time interval for the simualtion and the discrete step of control generation.
- The expected restriction for the second player's control Qmax.
- The method of the second player's control: sinusoid with an amplitude and wave length; or optimal game control corresponding to some restriction for the second player's control.
- The button, which starts calculations.
Now let's pass to the page with the simulation results.
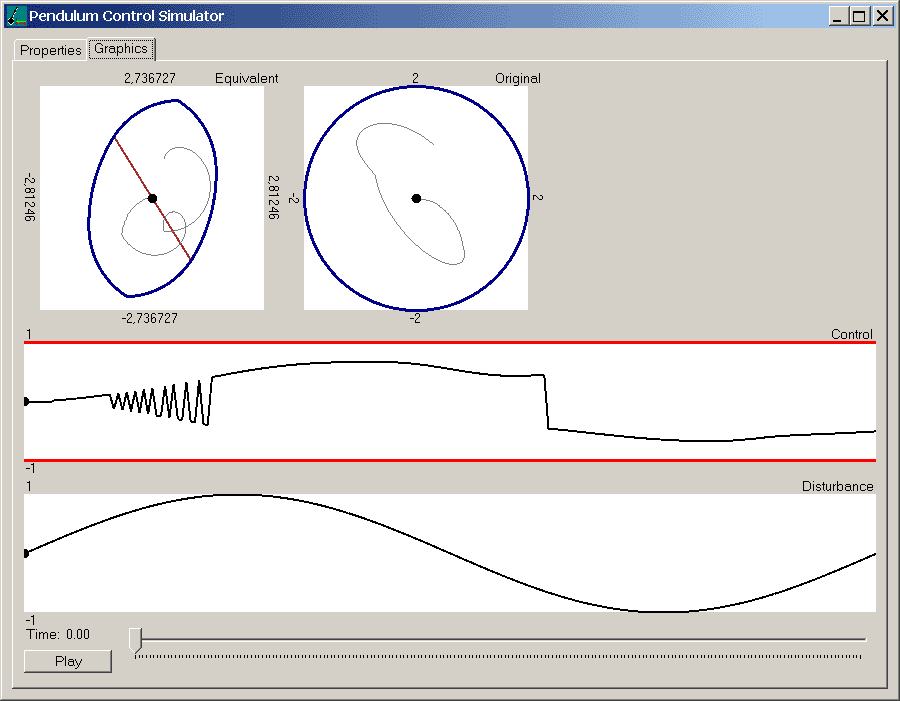
Here you can see graphs as in the firgure in the previous paragraph. The only difference is the buttons used to select the current instant.
4. Questions? Comments? Proposals?
You can contact Sergey Ganebny.